Neurotyping 101: Fundamentals
Neurotyping is a categorization system first presented by Beatrice Collins in April of 2020. It attempts to characterize the structure and dynamics of thought, the texture of the mind, on a 2D graph, usually split into 16 categories with cute names. Its goal is to answer the fundamental question: How think?
Here's the standard chart:

...and here's another version by Ouroborista, with sillier names:

The x-axis measures impressionism, as opposed to lexicality. This is a description of the "structure" of the thoughts themselves, or rather, the way those thoughts are organized in your mind.
Lexical thinking uses words, symbols, rules, or categories.
Impressionistic thinking is a more "raw" kind of thought, vaguely associated with intuitions or 'vibes'. Though some take issue with these associations- interpretations diverge. The point is that it is noncategorical.
Impressionistic thinking is a more "raw" kind of thought, vaguely associated with intuitions or 'vibes'. Though some take issue with these associations- interpretations diverge. The point is that it is noncategorical.
The y-axis measures laterality, as opposed to linearity. This is a description of the way you transition between thoughts, or the way you hold thoughts in your head at a given moment.
Linear thinking is more "straightforward", going from one idea to another related idea in a structured way.
It is "in the moment", tracing a line of thought.
Lateral thinking is nonlinear, jumping between disconnected concepts. It is sometimes described as a "thought cloud", or a constellation, as opposed to a trajectory. It was originally conceived as the literal ability to have multiple trains of thought at once, but this description has been largely abandoned.
Lateral thinking is nonlinear, jumping between disconnected concepts. It is sometimes described as a "thought cloud", or a constellation, as opposed to a trajectory. It was originally conceived as the literal ability to have multiple trains of thought at once, but this description has been largely abandoned.
The premise of the chart is that these 4 traits form diametrically opposed pairs, and that all thinking can be measured on these 2 scales. For example: Becoming less impressionistic is the same thing as becoming more lexical, according to the theory.
Most Neurotyping material can be found on the subreddit, including many explanations, visualizations, examples, and theories. All of the images in this post come from there. There's also the Neurocord, which is supposedly where most of the actual activity is at these days, though I'm not very familiar with it personally. Lastly, there's the Neurotypeline podcast, which discusses the community's theoretical developments.
Typing People and Media
Though Neurotyping is fundamentally a thought categorization system, it is nonetheless used to categorize people. This comes with some obvious difficulties, because people are complicated. Of course, people are ultimately the thing we want to understand, so we try our best.The most simple, naive way of typing a person is with a point on the chart. This point acts as a general, approximate description of the way you tend to think. Finding an exact point is difficult, so we usually just find the best-fitting category. I, for example, label myself as an Overseer, or alternatively, a Conceptopologist.
Sometimes, it is useful to zoom out even further, and simply talk about each quadrant. The quadrants may be labeled (left to right, top to bottom) as: Network, Entropy, Order, and Instinct. (Oftentimes "Entropy" is instead called "Abstract", and "Network" called "Compute", but I dislike these names.) They have also been called: Nerd, Goth, Prep, and Jock.
Types are sometimes assigned to media, despite media not having "thoughts", per se. At this point, we're really transcending the original domain of the theory (thoughts), and thinking of the axes in a more broad, abstract sense. What it means for a piece of media to have a neurotype varies case-by-case. It tends to relate to the neurotype of the audience the media tends to appeal to, or the type of thought the media seems to be trying to communicate.
I would speculate that, since neurotypes describe thought, anything that can be thought about can be neurotyped. The neurotype of something "mindless" is a description of the way that thing is "most naturally conceived of".
Examples
The most common way that people interact with the theory is by making graphical collections of typings for characters, media, people, and other miscellaneous categories of things. For example, here's a "normie media chart". (Posted by Reddit user /u/monkaap)
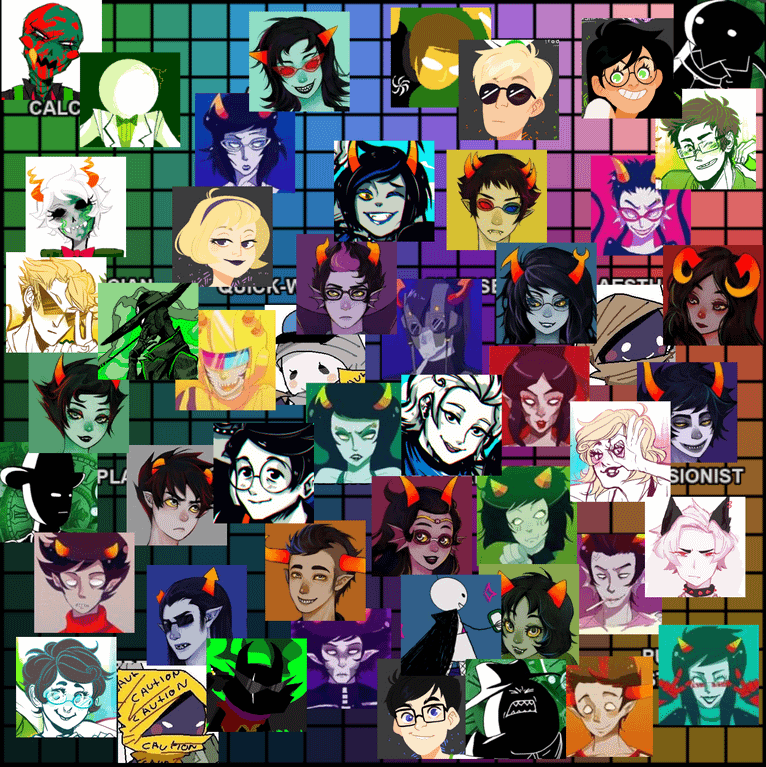
Here's a Homestuck one, by Ouroborista.
Someone called CAT has made a huge spreadsheet compiling people's typings, including both real people and fictional characters. Have a look, and ctrl-f your favorite character.
Scale
Something I personally have struggled with is getting a feel for the scale of the axes. There are no obvious numeric ways of measuring these traits, so it can be difficult to get a grasp on exactly where the borders between categories are.The chart implicitely assumes that these qualities can be measured like a percentage, that there is a maximum/minimum cap on how impressionistic/lateral it's possible for someone to be. Even if this is the case, it probably isn't very useful, because the outer limits are likely cartoonish outliers. Realistically, nobody could ever be maximally lateral, for example. So then, how do we scale our axes?
Usually, the scales are changed according to the whims of the person doing the categorization. They are dynamically exaggerated to most clearly visualize the relevant distinctions, depending on the group of people being typed. Essentially, it's just "played by ear".
A Meta Note
As you may have noticed, the chart itself embodies an interesting mixture of the qualities it seeks to measure. It is categorizing thoughts, into 16 neurotypes, which is a fundamentally lexical idea. But the system of categorization is actually fairly impressionistic. When typing, people tend to "feel out" the positions, rather than using any sort of orderly process. The chart is also linear, in the sense that it is literally a linear vector space. But the application of the types tends to be more lateral, when broadly compressing many of a person's traits, or when abstracting/generalizing the types to disparate situations.Though I've tried to give a fairly specific description of the theory here, nothing is really fully agreed on. There are many divergent interpretations of the axes, and it can be difficult to even know to what extent two people's definitions overlap. This, again, speaks to the impressionism of neurotyping itself, that it can be difficult to explain using language.
Neurotyping 102: Ever-Branching Paths
Neurotendencies
It was quickly realized that a single point on the chart is not a very accurate description of a person, because a person's neurotype is not static. There's more than one way to handle this issue, but the most popular method is to use a heatmap. Here is one I made for myself back in October of 2020:
(I don't think this is actually accurate for me.)
This sort of broader description can be called a "neuro-tendency", as opposed to a type. Personally, I have a lot of trouble reaching this level of specificity, even for myself.
Notice that a heatmap is an inherently lateral description: It's literally a "cloud" of neurotype. This inspired me to propose an alternative, more linear approach. In this model, we still describe one's type as a point. But then, we use vectors associated with different contexts, pushing our type in different directions along the chart. Using this method, you can describe the dynamics of your neurotype like forces on a particle. For example, you might have a vector pointed upward for when you drink coffee, indicating that coffee makes you more lateral. I've dubbed the vectors "neuromentum vectors".
Relatedly, there's what's sometimes known as Context Theory, the idea that people have specific neurotypes for different contexts (sometimes attributed to Victor Collins). I think the distinction between the Context and Neuromentum theories is in the positional relativity of the dynamics. Neuromentum Theory says that each context will "push" you in a direction, whereas Context Theory says that each context moves you to a specific point. The importance of this distinction is unclear, and I would guess that both of these effects exist.
The Chaos Axis
In my opinion, one of the most interesting developments has been "Chaos Theory".
(Image source)
The idea here is that you can change your coordinates to find new, unique axes. The most interesting one is from Bookkeeper to Newtype, the Order/Chaos axis. This implies that the original 2 axes can be described in terms of what particular flavor of chaos they measure.
Impressionism is when thoughts are categorized chaotically, it would seem.
Low impressionism implies everything is neatly understood in terms of some categorical framework.
High impressionism implies there is no structure, everything is "its own thing".
Laterality is chaotic time evolution of thoughts. Low laterality implies your mind-state evolves smoothly and orderly. High laterality implies you bounce quickly from thought to thought in a disconnected manner.
Laterality is chaotic time evolution of thoughts. Low laterality implies your mind-state evolves smoothly and orderly. High laterality implies you bounce quickly from thought to thought in a disconnected manner.
Thinking of chaos as entropy, one might speculate that over time, people would drift toward Newtype. Interestingly, though, it is moreso speculated that people tend to drift downward as they age.
A Taste of Timecake
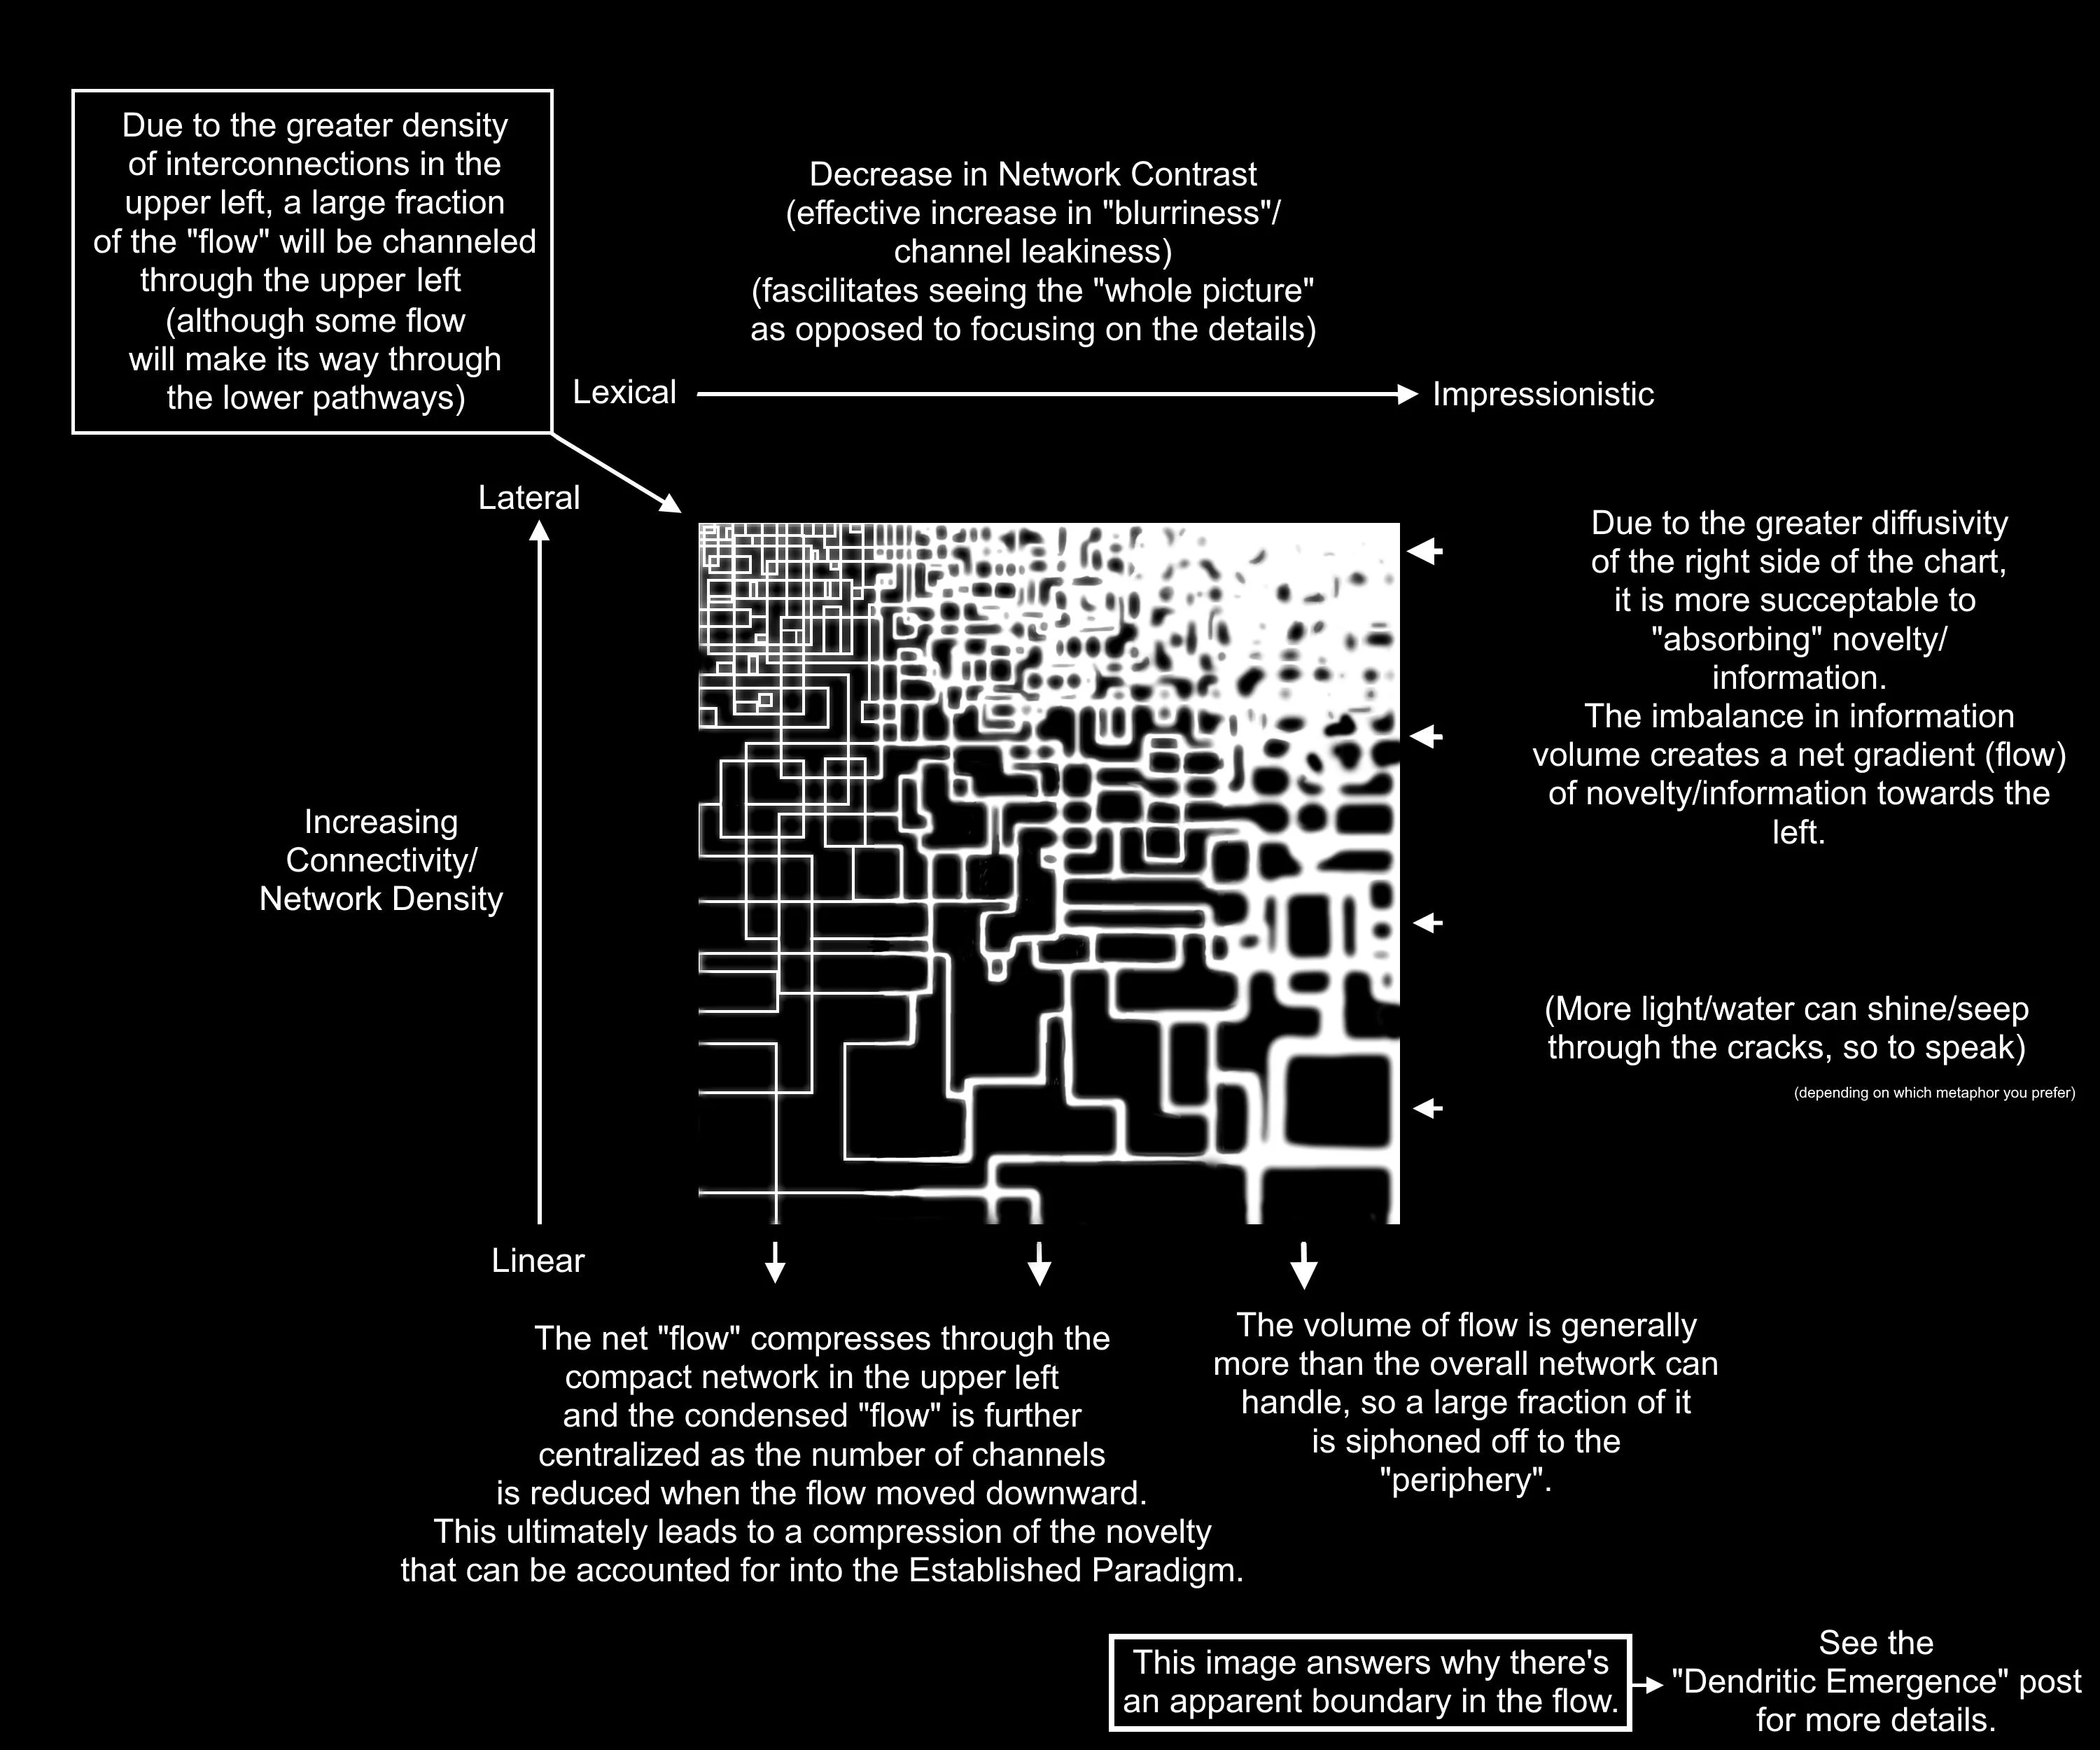
Reddit user /u/Timecake was a noteworthy figure in the neurotyping space, and any self-respecting neurotyperson should be familiar with them. Breaking down any of their actual theories would be beyond the scope of this post. Instead, I will simply show one of their diagrams, and let it speak for itself.
Discovering, Processing, and Formalizing Ideas
In the context of developing ideas, there seems to be a certain ideal "flow" through the chart. It begins on the right side, drifts up and to the left, then curves down to the bottom. Something like this: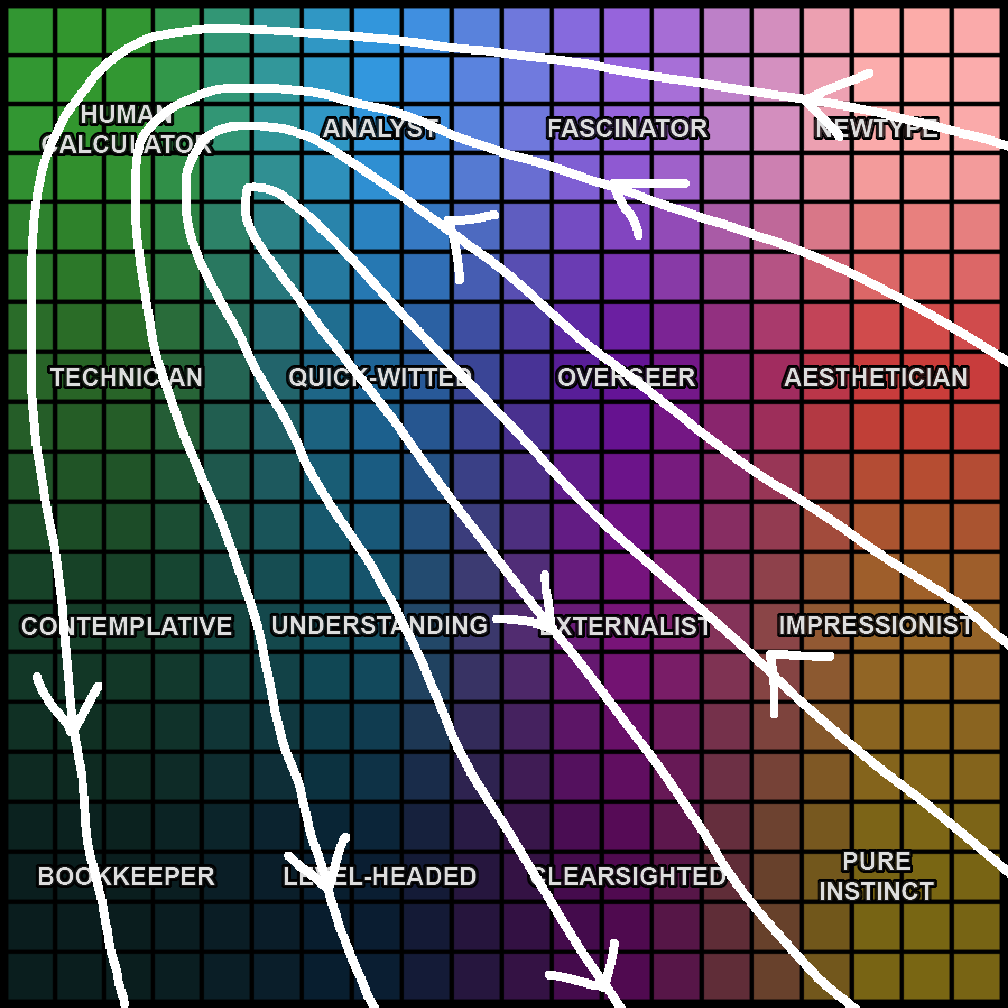
Here's how I would explain it:
Highly impressionistic thought tends to be better at generating novel ideas, since, being anti-categorical, it is less tethered by existing conceptual paradigms. Once you've found a new, interesting idea, you want to explore it, thinking through all its consequences, relationships, and so on. This is an inherently lateral process, and it leaves you with a huge swarm of connected concepts. The exploration process will likely include putting the idea in increasingly lexical terms, if only because it makes communication (and thus, collaboration) easier. At that point, it is often useful to "carve down" and axiomize this swarm, to find its 'essence' in some sense, or reduce it to core principles. That's to say, you linearize it.
Put simply: New ideas are first discovered from the realm of impressionism. Then, they are processed, which involves laterality and, increasingly, lexicality. Finally, they are formalized, made linear.
Here's Timecake's thoughts on the subject.